

The True Cost of a Comfortable Retirement: How Much You Really Need to Save by Starting Age


So there's this number floating around that Americans say you need $1.46 million to retire comfortably. It comes from Northwestern Mutual's 2026 Planning & Progress Study. It's up $200,000 in a single year and more than 50% since 2020. It's just one of a dozen different retirement planning rules of thumb people reach for when the math feels too big to do themselves — and it might be the least useful one.
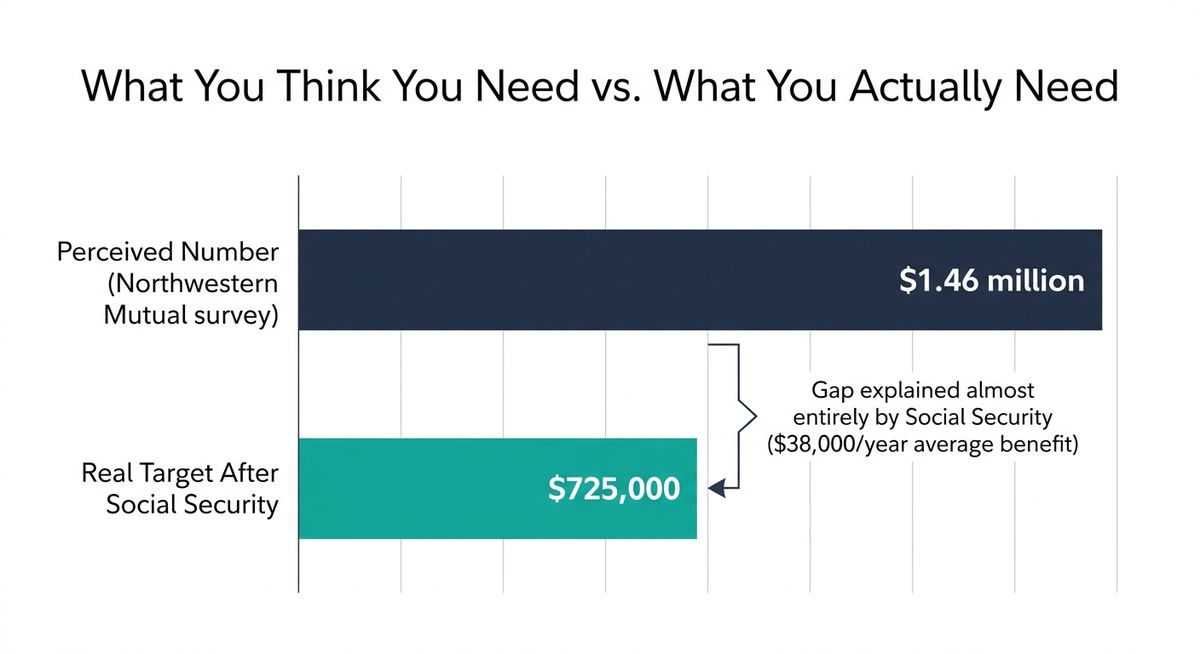
- The "$1.46 million" number everyone's scared of skips Social Security. A typical two-earner household actually needs closer to $725,000.
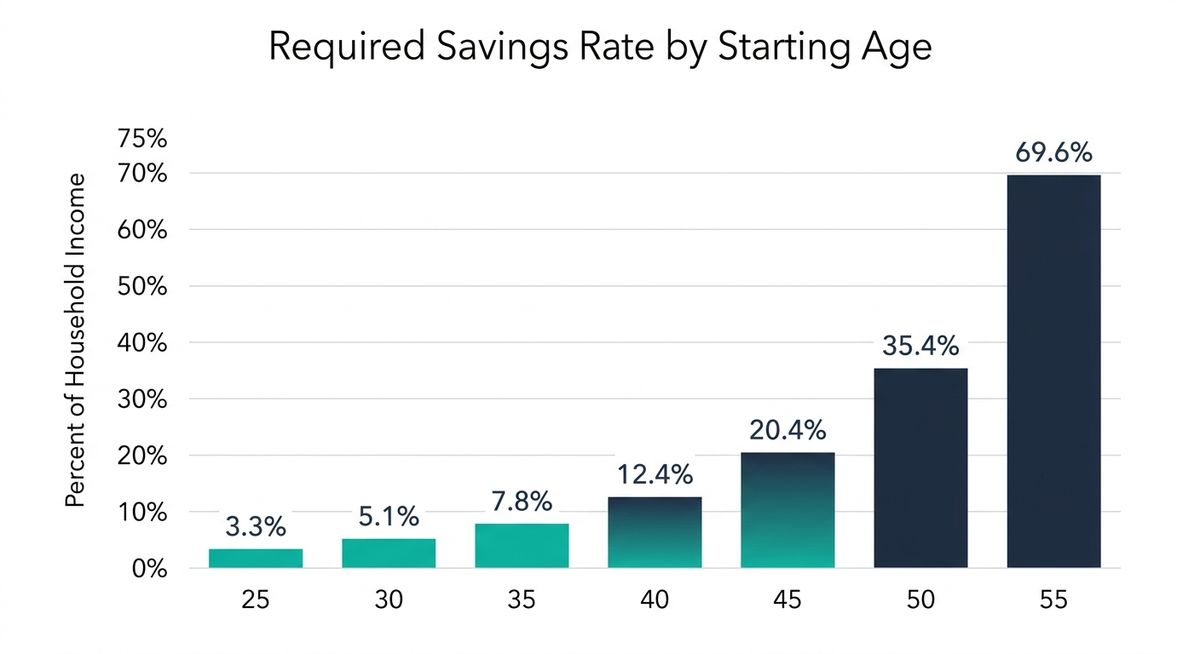
- Your required savings rate ranges from 3.3% of income at age 25 to 69.6% at age 55 — the single most expensive decision in personal finance, made almost entirely by accident.
- At age 55, the required contribution is literally more money than the IRS lets you shelter in tax-advantaged accounts. The plan has to change, not just the savings rate.
- Working to 70 and claiming Social Security at 70 cuts the required nest egg by roughly 31% — more than any realistic increase in your savings rate.
Action: Find your age in the table below, compare it to your current contribution rate, and close the gap by one percentage point today.
And honestly? That number does more harm than good. I've watched friends see it, do the mental math, decide the whole thing is hopeless, and then go buy a boat.
Here's the thing. Once you actually break down retirement savings by age instead of staring at one scary lump number, the math says something way less scary. For a typical two-earner household, you're looking at closer to $725,000. The gap between those two numbers exists for one reason: when you survey people about retirement, they forget about Social Security. Which is wild, because for almost every retirement plan in this country, Social Security is quietly the biggest asset in the whole thing.
So let's break down what $725,000 actually costs you, depending on when you start. It ranges from 3.3% of your paycheck to nearly 70% of it. That spread right there is the most expensive decision in personal finance, and most people make it by accident.
Start With What You Actually Earn: Median Household Income
Median U.S. household income is $83,730. That's the Census Bureau's official 2024 figure, and it's the anchor for everything below.
The planning benchmark everyone uses is an 80% income-replacement rate. For the median household, that's $66,984 a year in retirement. Not 100%. And that 20% haircut isn't you eating rice and beans, it's just arithmetic:
Where the 20% Goes
- You stop saving for retirement. That 10% to 15% you were socking away? Gone the day you retire, because you're retired.
- Payroll taxes vanish. Social Security and Medicare taxes (7.65%) don't apply to retirement withdrawals.
- Commuting, parking, dry cleaning, sad desk salads. All of it shrinks or disappears.
- The mortgage is often paid off, or close to it, by 67.
There's a second reason 80% is on the conservative side. David Blanchett did research on what he calls the "retirement spending smile" (Journal of Financial Planning, 2014) and found that real spending actually drops about 1% a year in the first decade of retirement, then roughly 2% a year through the middle years, before it flattens back out as health costs kick in. A household that starts at $100,000 of spending bottoms out near $74,146 around age 84. That's a 26% decline.
The Retirement Spending Smile
Now, that finding is debated, not settled. I'm not going to pretend it's gospel. But if you plan for flat 80% spending across 30 years, you're building in a cushion rather than a risk. I'll take that trade.
The Nest Egg Math: Why $725,000, Not $1.46 Million
You don't have to fund that whole $66,984 out of your own portfolio. Social Security takes a big bite out of it first.
The average 2026 benefit for a couple where both spouses are collecting is $3,208 a month, or $38,496 a year, per SSA's COLA fact sheet. Let's round down to a slightly conservative $38,000. That one line item replaces 45.4% of the median household income before you've saved a single dollar.
Which leaves the real number:
$66,984 − $38,000 = $28,984 a year your savings has to cover.
Now apply the 4% rule, which says a portfolio can handle a 4% withdrawal in year one, adjusted for inflation after that, across a 30-year retirement:
$28,984 × 25 = $724,600. Call it $725,000.
But does the 4% rule still work?
Fair question, and it's genuinely contested right now. We've dug into why some planners think the 4% rule is broken in 2026, and that debate matters here too. Worth understanding the argument:
Bill Bengen
- Method Historical data since 1926
- Worst-case safe rate 4.7%
- Reasonable rate today 5.25%–5.5%
- Implied nest egg ~$617,000
Morningstar
- Method Forward-looking Monte Carlo
- 2026 safe rate 3.9%
- Accounts for High valuations, low yields
- Implied nest egg ~$743,000
Here's what I love about $725,000: it sits comfortably inside that entire expert range. That's exactly what you want from a planning number. It doesn't require you to pick a winner in an academic argument you have no business refereeing.
If you're single, this changes a lot
Single-Filer Math
Almost every retirement article out there models a couple, and I get why, but it leaves a lot of people out. A single retiree gets one Social Security check, roughly $25,000 a year, while paying pretty much the same housing, utility, and insurance costs. Rent doesn't get cheaper because you live alone.
So the annual gap widens to $41,984, which works out to $1.05 million at a 4% withdrawal rate. If your earnings record is below average, or you want a more conservative withdrawal rate, you're climbing toward $1.4 million. If you're planning solo, use those numbers. Not $725,000.
The Timeline Breakdown: What Retirement Savings by Age Actually Cost
Here's what it takes to hit $725,000 by age 67 starting from zero, assuming a 7% long-run average return with an age-appropriate glide path that gets more conservative as you approach retirement. Basically, the way target-date funds already work.
| Starting Age | Years to Save | Annual Savings Required | Monthly Contribution | % of Household Income ($83,730) |
|---|---|---|---|---|
| Age 25 | 42 | $2,785 | $232 | 3.3% |
| Age 30 | 37 | $4,228 | $352 | 5.1% |
| Age 35 | 32 | $6,539 | $545 | 7.8% |
| Age 40 | 27 | $10,361 | $863 | 12.4% |
| Age 45 | 22 | $17,046 | $1,421 | 20.4% |
| Age 50 | 17 | $29,660 | $2,472 | 35.4% |
| Age 55 | 12 | $58,300 | $4,858 | 69.6% |
Monthly figures are approximate. It's just the annual number divided by 12.
One honest caveat on that 7%. Vanguard's capital markets model currently projects 3.9% to 5.9% annualized for U.S. equities over the next decade. Over 40 years, assuming 7% is defensible. Over 12 years, it's an act of faith. That asymmetry is itself an argument for starting early, and it's why you should read those late-starter rows as a floor, not a ceiling.
The Early Bird (Age 25 to 30): 3.3% to 5.1%
At 25, you need $232 a month. That's a phone bill and a couple streaming subscriptions.
Even at 30, it's only 5.1%. If your employer matches 4% of pay, that match alone covers nearly 80% of what you need. On somebody else's money. My friend David set his up at 28, told me he "basically forgot about it," and that's exactly the point.
The Mid-Career Pivot (Age 35 to 40): 7.8% to 12.4%
This is when most people actually start paying attention, usually around the time a birthday with a zero in it shows up. Good news: the math still works without heroics. At 35, 7.8% does it. At 40, 12.4%.
Both of those live inside the 15% 401(k) savings rate guideline you've seen a hundred times. And here's the reframe that makes 12.4% feel completely different:
The Match Reframe
Fidelity's 15% rule includes your employer match. A 40-year-old with a 4% match is personally kicking in about 8.4%, or roughly $586 a month instead of $863. I've seen people talk themselves out of starting because they looked at $863 and decided it was impossible, when the number they actually had to find was closer to $586.
The other thing working in your favor at this stage: mid-career is usually when your income peaks. A 12.4% savings rate at 40 is uncomfortable. It is not impossible.
The Late Starter (Age 45+): 20.4% and Climbing Fast
At 45, you need 20.4% of gross income. At 50, 35.4%. At 55, 69.6%.
The Early Bird — Age 25
- Years saving 42
- Own contributions $116,970
- Share from growth ~84%
- Ends with $725,000
The Late Starter — Age 55
- Years saving 12
- Own contributions $699,600
- Share from growth ~3.5%
- Ends with $725,000
He's not really investing. He's buying his retirement outright, at full retail.
Compounding isn't a bonus for starting early. It's the discount you give up by starting late.
And this isn't hypothetical. The median 401(k) balance for savers aged 55 to 64 is $95,642 (Vanguard, How America Saves 2026). That's 13% of the $725,000 target, with about a decade left on the clock. If you're in this window, here's a more focused rundown of what actually moves the needle if you want to retire in your 50s.
The Ceiling Nobody Talks About: The Tax Code Runs Out Before You Do
Here's something missing from basically every "here's what you must save" article I've ever read. At some point, the amount you need to contribute is more than the IRS will physically let you shelter. The government caps how much you can put in these accounts, and the cap doesn't care about your situation.
| 2026 Limit | Amount |
|---|---|
| 401(k)/403(b)/457 deferral | $24,500 |
| Age 50+ catch-up | $8,000 (total $32,500) |
| Ages 60–63 "super catch-up" | $11,250 (total $35,750, 4 years only) |
| IRA | $7,500 + $1,100 catch-up ($8,600) |
| HSA | $4,400 self-only / $8,750 family, +$1,000 at 55+ |
Now map that against the table:
- Age 45 ($17,046): Fits inside the 401(k) limit by itself, with room left over.
- Age 50 ($29,660): Fits inside the $32,500 401(k)-with-catch-up limit, but only if you max it. This is the single cleanest instruction in this whole article: at 50, max the 401(k) including catch-up, and you're on track. That's it. That's the assignment.
- Age 55 ($58,300): Max the 401(k) with catch-up, plus a full IRA, plus a family HSA at 55+, and you get to $50,850. And that last piece assumes you're on a high-deductible family plan. You're still $7,450 short, and that remainder has to go into a taxable brokerage account.
If both spouses have workplace plans, household capacity roughly doubles and the age-55 number becomes technically shelterable. Still not affordable, though. Saving 69.6% of gross income on a median salary is arithmetically impossible after taxes. There isn't enough paycheck.
That's not a reason to give up. It's a reason to change the plan instead of just cranking the savings rate.
The Strategic Playbook: Late-Starter Retirement Strategies Ranked by What Actually Moves
If you're behind, here they are, ordered by how much math they move. Not by how often you hear about them.
- Work to 70 and claim Social Security at 70. Delayed retirement credits add 8% a year past full retirement age. From FRA 67 to 70, that's a permanent 24% increase. Your $38,000 household offset becomes $47,120, the annual gap drops to $19,864, and the required nest egg falls from $725,000 to $496,600. For the full tradeoffs at every claiming age, see our age-by-age breakdown of when to claim Social Security. Working those three extra years is what makes that number real, because it also buys you three more years of contributions, three more years of compounding, and three fewer years of drawdown. Run it for the 45-year-old: the required contribution drops from $17,046 a year to roughly $9,200. About $770 a month, or 11% of income. You just cut your savings rate in half with a decision that costs you nothing today. You can also claim at 70 without working to 70, but be honest with yourself about what that costs — you have to self-fund the full $66,984 from 67 to 70, roughly $114,000 of extra withdrawals, pushing your effective target back up to about $610,000. Still a 16% reduction, just not a 31% one. Credits stop accruing at 70, so filing later gains you nothing, and break-even typically lands in your early-to-mid 80s.
- Max your catch-up contributions. An extra $8,000 into the 401(k) and $1,100 into the IRA once you hit 50. From 60 to 63, the super catch-up pushes the 401(k) total to $35,750, but only for those four years. At 64 it drops back to $8,000. Use the window while you've got it.
- Budget for the new Roth catch-up rule. Starting in 2026, if you're 50 or older and earned more than $150,000 in prior-year FICA wages (check Box 3 of your 2025 W-2), your catch-up contributions have to be Roth. You lose the upfront deduction, so plan for a bigger tax bill this year. Honestly, the tax-free growth is probably the better deal anyway if you expect a large balance. But nobody likes a surprise in April.
- Treat your HSA like a stealth retirement account. $8,750 family or $4,400 self-only in 2026, plus $1,000 more at 55+. Triple tax advantage, and it funds a bill you're actually going to get: Fidelity estimates a 65-year-old couple retiring in 2026 will spend $371,000 out of pocket on health care. That's up 7.5% in one year, and it excludes long-term care.
- Get the full employer match before you do anything else. Instant 50% to 100% return, and it counts toward your target rate. This is the closest thing to free money that exists.
- Redirect the cash flow that frees up. Go read the catch-up threads on Bogleheads sometime. The pattern is remarkably consistent: savings rates jump from 15% to 40% or 60% the moment the mortgage is paid off and the last tuition check clears. If you're in your 50s, that's almost always where the real money comes from. Not from skipping coffee.
- Build a cash buffer for your first five years of retirement. Bad returns in those opening five years drive roughly 70% of retirement plan failures — what we've called the silent retirement killer. Historically, safe withdrawal rates have been lowest for people who retired when stock valuations were stretched, and the Shiller CAPE ratio is sitting near 40 right now. A 55-year-old has no time to recover from a rough first decade, which is a much stronger argument for working to 70 than any contribution-limit math I can show you.
One Stress Test Before You Close This Tab
Every number up there assumes Social Security pays what it promises. So let's test that, because I know it's what you're thinking about.
What If Benefits Get Cut?
The 2026 Trustees Report gives you two answers depending on which fund you look at. The combined OASDI trust fund depletes in Q3 2034 with 83% of benefits still payable. The retirement fund by itself (OASI) depletes in Q4 2032 with 78% payable. Call it somewhere between 2032 and 2034, with benefits cut 17% to 22% if Congress does nothing.
Run the worst case. A 22% cut drops that $38,000 Social Security offset to $29,640, widens the annual gap to $37,344, and pushes the target nest egg to $933,600. That's a 29% increase. A 40-year-old's required savings rate goes from 12.4% to about 16%.
So if Social Security uncertainty is what keeps you up at night, plan against that number. It's higher. It's not catastrophic. And it's still a third less than the $1.46 million people think they need.
What To Do This Week
🎯 Close the Gap, Starting Now
- Find your age in the table: That's your retirement savings by age starting point.
- Check your current rate: Log into your 401(k) and compare your current contribution percentage to it.
- Close the gap by one point: If there's a gap, close it by one percentage point today, then set up a 1% automatic escalation every January. You will not feel either one.
- Model the two free levers: What happens to your number if you work to 70, and what happens if you claim Social Security at 70. If you're 45 or older, those two decisions move the needle more than every extra dollar of saving combined.
The 25-year-old wins with $232 a month and never thinks about it again. Everybody else wins by being deliberate about the levers still on the table. Both work. Only one of them is automatic.
Thanks for reading if you've made it this far. Now go log into that 401(k).
Peace!